Sit back, this is a long one with a lot of numbers.
For this exercise, I looked at non-conference opponents over the last six seasons (2012-2017). That range is a bit arbitrary, as I just got tired of making notes any further back, but we also start to have to start dealing with major conference realignment at that point. One downside to this sample size is that it doesn't always capture a full series between two opponents.
For the purposes of this discussion, I had to make a few judgement calls:
- The only independent that I count as a Power 5 team is Notre Dame. BYU, Army, and pre-2015 Navy count as Group of 5 teams. Regardless of what anyone tries to say, Notre Dame is the only independent team that has been treated as being on the same level as the Power 5, AQ, or BCS conferences over the last few decades. When the service academies have not been independent, they are or have been part of Group of 5 conferences (Air Force in Mountain West, Army previously in CUSA, and Navy currently in the American).
- The Big East in 2012 and American in 2013 count as Power 5 teams, as they still had automatic qualifier access to the BCS in those years. The American didn't get bumped down out of the Power conferences until the CFP format took over in 2014.
- Teams still in FBS transition will count as FCS during those years. They were likely originally scheduled as FCS teams. Since they can't fully participate in FBS functions until the transition is over, there's no reason not to count them as FCS.
- I have included games that were scheduled but cancelled at the last minute, mostly due to weather, which affected a lot of teams in 2017. So, if a team had an FBS team scheduled, but either replaced them with an FCS team or no team, I still counted the original team that was scheduled. This is only for games that were changed after the season had already started.
Of course, this exercise does not include bowl games, as those are not scheduled by the individual schools.
In order to compare the scheduling efforts, I have developed a point system:
In the ACC and SEC, each team should have 24 non-conference games over six years. Big 12 and Pac-12 teams each should have 18 non-conference games over six years. The Big Ten has 22 non-conference games over the six years in this case study, as they switched from an 8 game conference schedule to a 9 game conference schedule prior to the 2016 season. Rutgers, Pitt, Syracuse, and Louisville each have an extra game in their counts due to being part of the 8-team Big East in 2012. I have subtracted two points from each of them, to make up for the extra Power 5 team they would have played in conference had such a team existed.
I think that the bare minimum in a given year for any team is to schedule 1 Power 5 team, allow for one FCS team on the schedule, and then fill the rest with Group of 5 teams. Therefore, the minimum number of points across a six year period would be equal to the number of non-conference games played. Of course, I feel that teams should strive to schedule above the minimum.
Atlantic Coast Conference
In order to compare the scheduling efforts, I have developed a point system:
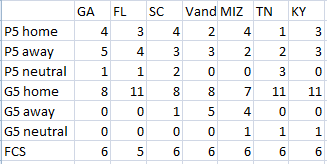
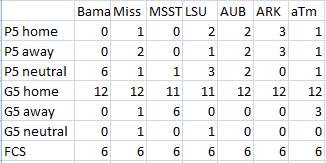
- Power 5 teams are worth 2 points.
- Group of 5 teams are worth 1 point.
- FCS teams are worth 0 points.
In the ACC and SEC, each team should have 24 non-conference games over six years. Big 12 and Pac-12 teams each should have 18 non-conference games over six years. The Big Ten has 22 non-conference games over the six years in this case study, as they switched from an 8 game conference schedule to a 9 game conference schedule prior to the 2016 season. Rutgers, Pitt, Syracuse, and Louisville each have an extra game in their counts due to being part of the 8-team Big East in 2012. I have subtracted two points from each of them, to make up for the extra Power 5 team they would have played in conference had such a team existed.
I think that the bare minimum in a given year for any team is to schedule 1 Power 5 team, allow for one FCS team on the schedule, and then fill the rest with Group of 5 teams. Therefore, the minimum number of points across a six year period would be equal to the number of non-conference games played. Of course, I feel that teams should strive to schedule above the minimum.
Atlantic Coast Conference
ACC Coastal

ACC Atlantic
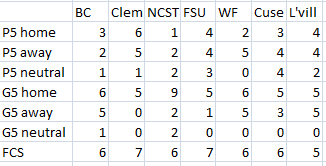
ACC Point totals
Clemson 29
Syracuse 28 (adjusted from 30)
Louisville 28 (adjusted from 30)
FSU 28
VT 27
Miami 27
Pitt 26 (adjusted from 28)
GT 26
UVA 26
Duke 25
UNC 25
WF 25
BC 24
NC State 23
Trends that I have noticed:
Southeastern Conference
- Virginia Tech likes to be the visitor first in most of their home-and-home series (specifically referring to Pitt and Purdue here). However, this has caused the numbers to be skewed a bit. Pitt joined the ACC in the middle of that two game series, and Purdue will not make the return trip until 2023.
- Boston College schedules the bare minimum.
- NC State is hardly trying.
- The Notre Dame deal is boosting the numbers of several schools at the bottom, most notably any school from North Carolina. (Boston College's score would probably remain about the same, because they scheduled Notre Dame on a regular basis before the ACC mandate.)
- Even though they have a permanent SEC rival, Clemson still goes out and schedules other home-and-home series against SEC teams.
- UVA has been punching above their weight class when it comes to scheduling for a while. Their current regime would like to fix that, as their coach went on record as saying he wants to play the worst Power 5 teams. Ironically, he said that during the same offseason that he cancelled the spring game because his team wasn't good enough to play itself.
- Florida State had originally scheduled a game against WVU in 2012, but WVU cancelled when they moved to the Big 12 and needed to adjust for a smaller non-conference slate. Due to the last minute cancellation, FSU was forced to pick up a second FCS team to fill the void. Had FSU been able to play WVU, we could add two points, and give them 30, putting them at the top of the conference.
- A few of the neutral site games were games that were part of a home-and-home series, but got moved. For instance, VT was supposed to visit Cincy in 2012 as a return trip from a 2006 game in Blacksburg, but Dan Synder bought that game and had it played at FedEx Field. Also, several of the Notre Dame games (before and after the mandate) are part of the "Shamrock Series" and are counted as ND home games, but played elsewhere.
Southeastern Conference
SEC East
SEC West
SEC point totals
Georgia 28
Florida 27
South Carolina 27
Alabama 24
LSU 24
Auburn 24
Arkansas 24
Missouri 24
Tennessee 24
Kentucky 24
Vanderbilt 23
Ole Miss 22
Texas A&M 21
Mississippi State 18
Trends:
- The SEC West does not like risky schedules. None of the seven teams in the division rise above the average score of 24, and only four even hit that average.
- The SEC East schedules much better than the West, with three teams scoring higher than average, and only one team scoring below the average.
- If I weighted for home vs. away, the point totals would be even lower for the West, although a few teams in the East might get bumped up.
- Alabama seems to only want to play non-conference Power 5 teams at neutral sites. Their last two home-and-home series occurred in 2010-2011 against Penn State, and a 2006/2010 series against Duke. They have recently announced home-and-home series against Texas (2022-2023) and Notre Dame (2028-2029).
- Kentucky's sole Power 5 opponent over the six years has been in-state rival Louisville. The last time they played a Power 5 team outside of their conference in the regular season was in 2005 against Indiana, and there are none on their future schedule, which is booked through 2023.
- Florida's four away games against Power 5 opponents include 3 trips to FSU and one trip to Miami. The last time they played a true road out of conference game outside the state of Florida was in 1991.
- The Sun Belt gets a lot of airtime on the SEC Network.
- The SEC is much less likely to schedule a home-and-home, or even a 2-for-1 deal with Group of 5 teams. Although, the 2-for-1 deal seems to be happening less frequently.
Looking at the SEC/ACC rivals, how do they stack up in Power 5 scheduling if we take out their 3 home and 3 away games against the rival?
Team (total) Home-Away-Neutral
Clemson (6) 3-2-1
Florida State (5) 1-1-3
Georgia (4) 1-2-1
Louisville (4) 1-1-2
South Carolina (3) 1-0-2
Georgia Tech (3) 1-1-1
Florida (2) 0-1-1
Kentucky (0) 0-0-0
Although, if we take out the Notre Dame deal for the ACC teams, then each of them drops down one game, but it would keep them ranked relatively the same as the list above. (I don't discount Georgia playing Notre Dame in 2017 because they made that deal on their own, it wasn't mandated by their conference.)
Of the 28 teams across the two conferences, 13 either hit the minimum or below, and most of them are in the SEC, including the entire West division.
If we adjust the standards to expect these teams to schedule 9 P5 teams over 6 years, then that would put our line at 27 points, which only 9 schools meet or exceed.
Now, we can do an extreme comparison to the other three conferences that play 9 conference games. They start out with 9 P5 teams on their schedule, and most folks probably expect them to play at least one more out of conference. To compensate, the ACC and SEC schools would be expected to play 2 P5 teams out of conference, which would put the expected point total to be 30, which every team fails to achieve. However, we'll look at a more fair comparison down below.
Big 12 Conference
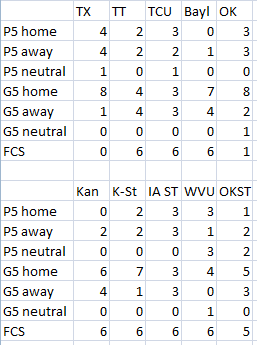
Big 12 Point totals
Texas 27
Oklahoma 24
WVU 19
TCU 18
Oklahoma State 18
Iowa State 18
Kansas State 16
Texas Tech 16
Kansas 14
Baylor 13
Trends:
Texas Tech 16
Big Ten Point totals
Michigan 32
Northwestern 28
Ohio State 27
Michigan State 26
Penn State 26
Iowa 25
Nebraska 25
Purdue 24
Wisconsin 24
Rutgers 23 (adjusted from 25)
Indiana 22
Maryland 22
Minnesota 22
Illinois 22
Trends:
Power 5 Comparison
Now is the time that we have to compare apples to oranges, since the five conferences handle their schedules differently. I could come up with some formula to adjust the point totals to try to even out the conferences, but that's a lot of math, and it was hard enough to count up the individual games and make sure I added them up correctly. Therefore, I am simply going to add points for the conference games to fill out a full 12 game schedule. In this case, the letter conferences would add 16 points per year (96 total), and the number conferences would add 18 points per year (108 total). The Big Ten will add 100 points to their total (4 years of 8 conference games and 2 years of 9 conference games).
This method also allows us to compare Notre Dame to the rest of the Power 5. Over six years, they scheduled 55 P5 teams and 17 G5 teams, providing a score of 127
I think we can all agree that we expect every team to schedule at least one P5 opponent out of conference per year. Then the argument comes in as to whether we're punishing one group of conferences for either having more or less conference games than the other. So, I will say that anything in the range of 120-126 should be considered the minimum. A six year schedule with 10 P5 games, 1 G5, and 1 FCS game per year would be 126 points. A schedule with 9 P5 games, 2 G5 games, and 1 FCS game would be 120 points. The teams in italics fall in that minimum range, while teams in bold exceed that range.
Big 12
Big 12 Point totals
Texas 27
Oklahoma 24
WVU 19
TCU 18
Oklahoma State 18
Iowa State 18
Kansas State 16
Texas Tech 16
Kansas 14
Baylor 13
Trends:
- Texas far exceeds the minimum of 18. The last time they played an FCS team was in 2006, back when the Big 12 actually had 12 teams, but only 8 conference games.
- Oklahoma's only FCS game in this span was in 2012.
- Baylor's lone Power 5 game occurred in 2017, against Duke. Even though it was away, it was not much of a risk. Granted, Baylor lost every game on their schedule except to Kansas (who in turn only had a single win).
- Iowa State's only Power 5 non-conference games come courtesy of their in-state rivalry with Iowa of the Big Ten.
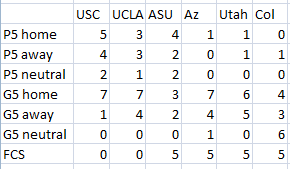
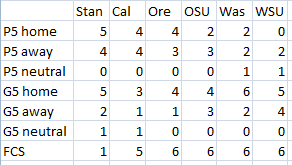
Pac-12 Conference
Pac-12 South
Pac-12 North
There are four teams in the Pac-12 that played at Hawaii, which means an extra home game to help offset the expense, except for 2014 Oregon State for some reason. I have included the numbers in the tables above, but will be adjusting the point totals below to keep it even to 18 games.
2013 USC's other games were at Notre Dame (part of an ongoing series, and away) Boston College (first half of a home-and-home), and Utah State. Utah State must be the extra game, so I will adjust USC's points down by 1.
2014 Washington's other games were Eastern Washington, Illinois (second half of sort-of-home-and-home), and Georgia State. Since Washington has a consistent history of playing FCS teams, I am counting Georgia State as the extra game, and adjusting Washington's point total down by 1.
2015 Colorado's other games were the neutral site Colorado State game (part of an ongoing series), Massachusetts (second half of a home-and-home series), and Nicholls State from the FCS, which will get counted as the extra game. This does not require Colorado's score to be adjusted.
Pac-12 Point totals
USC 29 (30)
Stanford 26
UCLA 25
Arizona State 21
Cal 21
Oregon 19
Washington 17 (18)
Oregon State 17
Utah 15
Colorado 15
Washington State 15
Arizona 14
Trends:
- For a while, I know that the Pac-12 and Big Ten tried to have an agreement where all of their teams played at least one team from the other conference. I don't think that got fully implemented before both conferences realized that the mandate was a bit too much. Still, there are about 4 times as many Big Ten games as there are any other conference.
- I think one thing holding the scores down for Utah and Colorado is that their main in-state rival(s) are at the Group of 5 level.
USC 29 (30)
Texas 27
Stanford 26
UCLA 25
Oklahoma 24
Arizona State 21
Cal 21
Oregon 19
WVU 19
TCU 18
Oklahoma State 18
Iowa State 18
TCU 18
Oklahoma State 18
Iowa State 18
Washington 17 (18)
Oregon State 17
Kansas State 16Texas Tech 16
Utah 15
Colorado 15
Washington State 15
Arizona 14
Kansas 14
Baylor 13
Twelve teams (out of 22) meet the minimum point total of 18, with only 9 exceeding that.
Twelve teams (out of 22) meet the minimum point total of 18, with only 9 exceeding that.
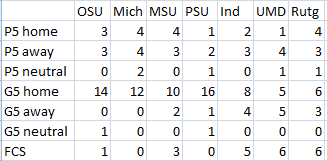
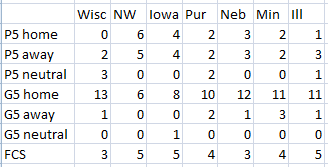
Big Ten Conference
Big Ten West
Big Ten East
Big Ten East
Michigan 32
Northwestern 28
Ohio State 27
Michigan State 26
Penn State 26
Iowa 25
Nebraska 25
Purdue 24
Wisconsin 24
Rutgers 23 (adjusted from 25)
Indiana 22
Maryland 22
Minnesota 22
Illinois 22
Trends:
- Maryland's number might be slightly skewed. Their neutral site games are actually home games that they move to either the Ravens or Redskins stadiums. It appears that they try to play one of their "home" games in an NFL stadium each year, and it rotates between conference and non-conference games. Also, there is a 2018 neutral site matchup against Texas that does not get counted to balance their trip to Texas in 2017. Likewise, their last series against WVU ran from 2010-2015, which included three trips to Hell, two home games, and one game in Baltimore.
- Rutgers has an extra game due to being in the smaller Big East Conference in 2012. I've adjusted their score by subtracting the two points they would have gotten by playing Arkansas, since that was their only Power 5 non-conference game that season.
- Iowa has Iowa State to give them a consistent Power 5 opponent every year. However, four of their 5 FCS opponents were ranked in the top 10 at that level, including the #1 and #2 ranked teams in 2016 and 2017.
- The Big Ten is the only conference where every team schedules at the minimum or above.
Power 5 Comparison
Now is the time that we have to compare apples to oranges, since the five conferences handle their schedules differently. I could come up with some formula to adjust the point totals to try to even out the conferences, but that's a lot of math, and it was hard enough to count up the individual games and make sure I added them up correctly. Therefore, I am simply going to add points for the conference games to fill out a full 12 game schedule. In this case, the letter conferences would add 16 points per year (96 total), and the number conferences would add 18 points per year (108 total). The Big Ten will add 100 points to their total (4 years of 8 conference games and 2 years of 9 conference games).
This method also allows us to compare Notre Dame to the rest of the Power 5. Over six years, they scheduled 55 P5 teams and 17 G5 teams, providing a score of 127
I think we can all agree that we expect every team to schedule at least one P5 opponent out of conference per year. Then the argument comes in as to whether we're punishing one group of conferences for either having more or less conference games than the other. So, I will say that anything in the range of 120-126 should be considered the minimum. A six year schedule with 10 P5 games, 1 G5, and 1 FCS game per year would be 126 points. A schedule with 9 P5 games, 2 G5 games, and 1 FCS game would be 120 points. The teams in italics fall in that minimum range, while teams in bold exceed that range.
USC 137
Texas 135
Stanford 134
UCLA 133
Oklahoma 132
Michigan 132
Arizona State 129
Cal 129
Northwestern 128
Ohio State 127
TCU 126
Washington 125
Oregon State 125
Iowa 125
Nebraska 125
Texas 135
Stanford 134
UCLA 133
Oklahoma 132
Michigan 132
Arizona State 129
Cal 129
Northwestern 128
Ohio State 127
Notre Dame 127
Oregon 127
WVU 127TCU 126
Oklahoma State 126
Iowa State 126
Michigan State 126
Penn State 126
Clemson 125Iowa State 126
Michigan State 126
Penn State 126
Washington 125
Oregon State 125
Iowa 125
Nebraska 125
Syracuse 124
Louisville 124
FSU 124
Georgia 124
Kansas State 124
Texas Tech 124
Purdue 124
Wisconsin 124
Kansas State 124
Texas Tech 124
Purdue 124
Wisconsin 124
Miami 123
VT 123
VT 123
Florida 123
South Carolina 123
Utah 123
Colorado 123
Washington State 123
Rutgers 123
Pitt 122Utah 123
Colorado 123
Washington State 123
Rutgers 123
GT 122
UVA 122
Kansas 122
Arizona 122
Indiana 122
Maryland 122
Minnesota 122
Illinois 122
Arizona 122
Indiana 122
Maryland 122
Minnesota 122
Illinois 122
Baylor 121
Duke 121
UNC 121
WF 121
BC 120
Alabama 120
LSU 120
Auburn 120
Arkansas 120
Missouri 120
Tennessee 120
Kentucky 120
NC State 119
Vanderbilt 119
Ole Miss 118
Texas A&M 117
Texas A&M 117
Mississippi State 114
Trends:
Trends:
- Of the 65 Power 5 teams, 47 fall into the minimum range. Only 13 teams exceed that range, while 5 fail to hit it.
- The entire SEC West comes in below the entirety of the Pac-12, Big Ten, and Big 12. The highest scoring teams are at 120, the bottom of the minimum range.
- No ACC or SEC team exceeds the minimum range.
- The team in the exact middle of this list is Virginia Tech, although with 123 points, they have the same score as Miami, Florida, South Carolina, Utah, Colorado, Washington State, and Rutgers.
- Of the nine teams to reach the College Football Playoff, only three teams exceed the minimum (Oklahoma, Oregon, and Ohio State). Alabama has the lowest score by a decent margin.
This will be interesting to revisit in a few years, to see how scheduling practices have changed, and if any teams make any drastic changes. I think we might be in the middle of a bubble where top teams are being more aggressive in scheduling better Power 5 games in the hopes of increasing their Playoff chances, until they realize that number of losses trumps strength of schedule in the eyes of the committee (but that's another post). Of course, as coaches and administrations change, then so do scheduling priorities.
No comments:
Post a Comment